Hi,
We are just starting to play with scheduled reports in Sonata Stats. The ones pulled on screen look really smart however when the PDF comes through on a scheduled email the formatting is all squashed and its missing graphs.
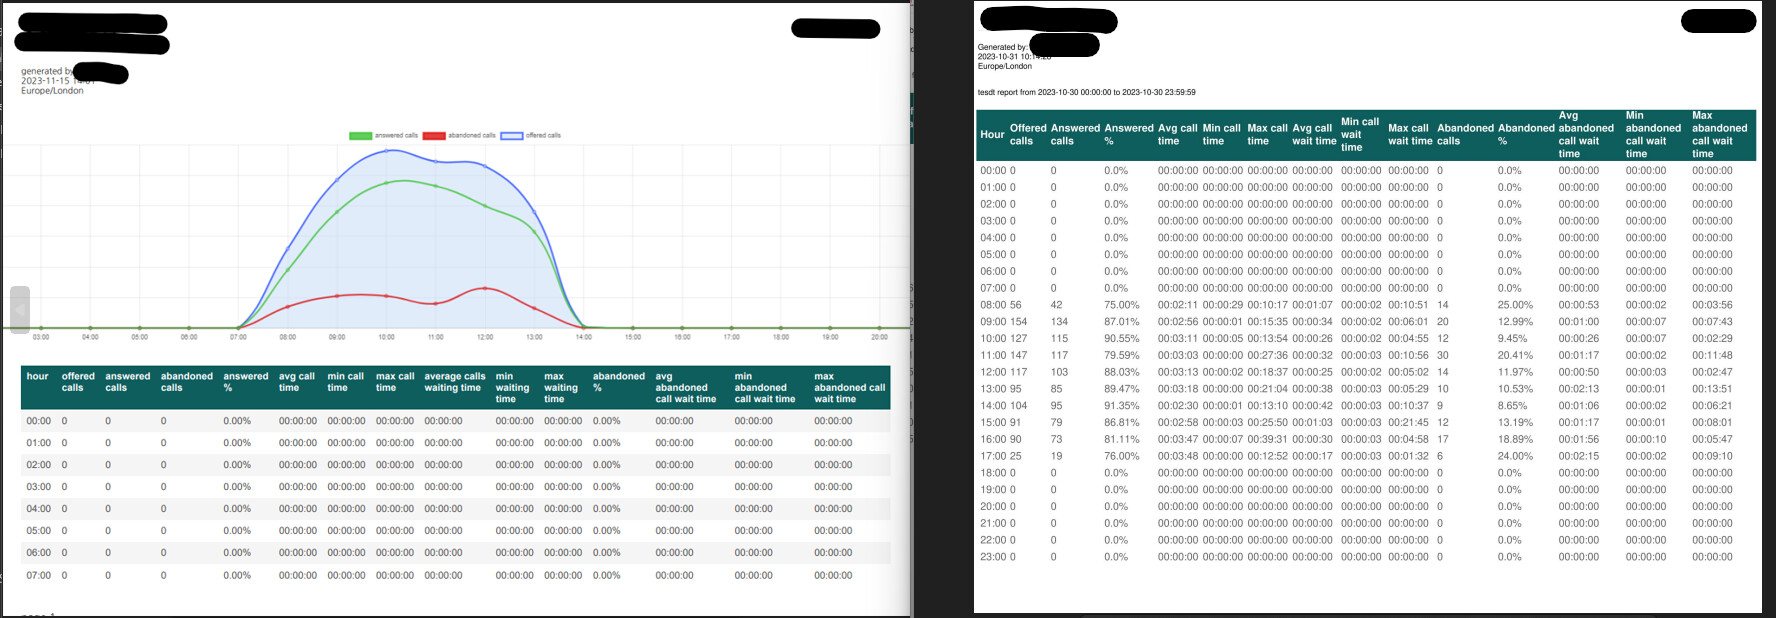
For example on the traffic by hour report on screen it looks like this (left) But when the same report arrives by email it looks like this! (right)
Hi, the generation of graphs requires a JavaScript library, which is only available in the GUI. When generating scheduled PDF reports, this library is not available.
Your case will be further reviewed. When a technique to incorporate graphics is developed, it will be included in future versions.
For the moment, the behavior you observe is as expected.