VitalPBX 3.2.3-9
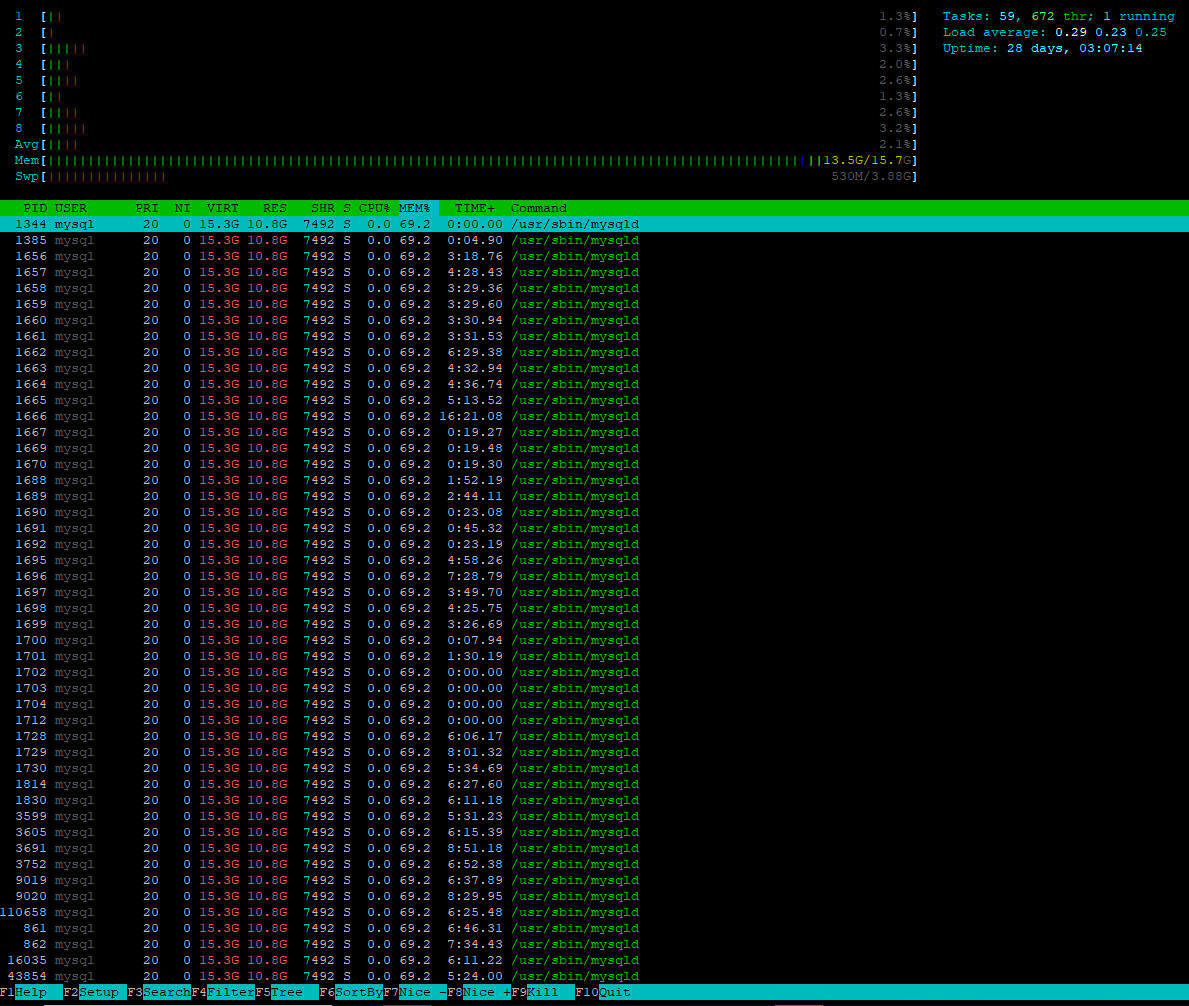
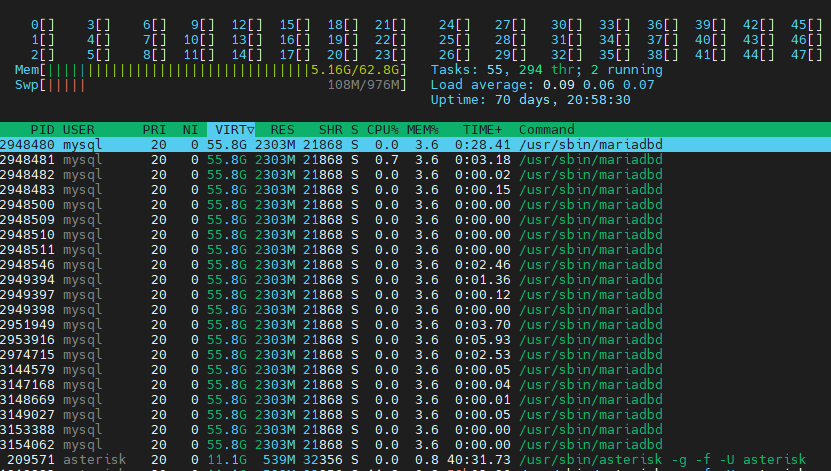
It seems like MySQL is eating most of the ram.
Try updating to the latest available version. It could be a Cron of a service executing multiple requests.
I’ll try and report back.
Updated. It still has this issue.
It seems like it happens post maintenance.
The question is… why do You have so many MySQL processes running.
can you log in to the MySQL server via the command line and run a “show processlist;” query
it should look similar to this:
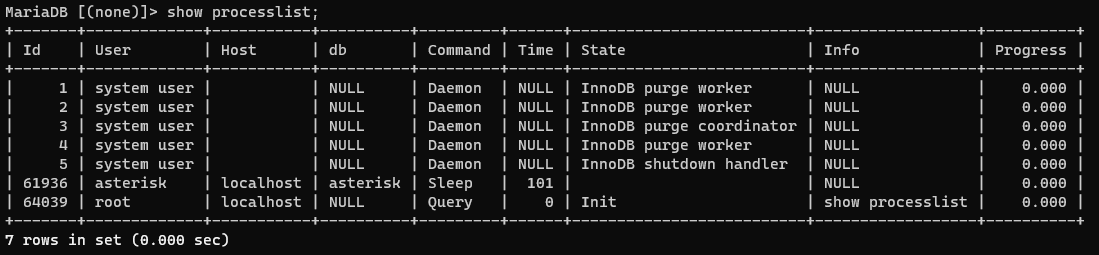
Seeing the running queries will help you to understand what is being processed and who/what is executing it and for how long.
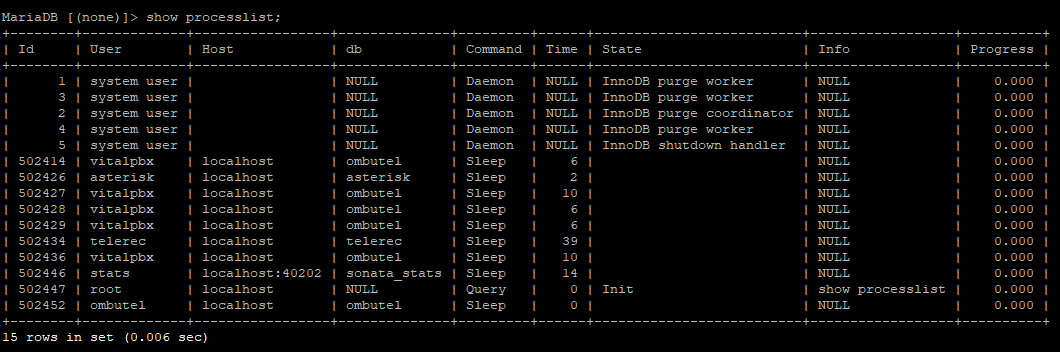
Here’s the list of all processlists
MariaDB [(none)]> show processlist;
+--------+-------------+-----------------+--------------+---------+------+--------------------------+------------------+----------+
| Id     | User        | Host            | db           | Command | Time | State                    | Info             | Progress |
+--------+-------------+-----------------+--------------+---------+------+--------------------------+------------------+----------+
|      1 | system user |                 | NULL         | Daemon  | NULL | InnoDB purge worker      | NULL             |    0.000 |
|      3 | system user |                 | NULL         | Daemon  | NULL | InnoDB purge worker      | NULL             |    0.000 |
|      2 | system user |                 | NULL         | Daemon  | NULL | InnoDB purge coordinator | NULL             |    0.000 |
|      4 | system user |                 | NULL         | Daemon  | NULL | InnoDB purge worker      | NULL             |    0.000 |
|      5 | system user |                 | NULL         | Daemon  | NULL | InnoDB shutdown handler  | NULL             |    0.000 |
| 502414 | vitalpbx    | localhost       | ombutel      | Sleep   |    6 |                          | NULL             |    0.000 |
| 502426 | asterisk    | localhost       | asterisk     | Sleep   |    2 |                          | NULL             |    0.000 |
| 502427 | vitalpbx    | localhost       | ombutel      | Sleep   |   10 |                          | NULL             |    0.000 |
| 502428 | vitalpbx    | localhost       | ombutel      | Sleep   |    6 |                          | NULL             |    0.000 |
| 502429 | vitalpbx    | localhost       | ombutel      | Sleep   |    6 |                          | NULL             |    0.000 |
| 502434 | telerec     | localhost       | telerec      | Sleep   |   39 |                          | NULL             |    0.000 |
| 502436 | vitalpbx    | localhost       | ombutel      | Sleep   |   10 |                          | NULL             |    0.000 |
| 502446 | stats       | localhost:40202 | sonata_stats | Sleep   |   14 |                          | NULL             |    0.000 |
| 502447 | root        | localhost       | NULL         | Query   |    0 | Init                     | show processlist |    0.000 |
| 502452 | ombutel     | localhost       | ombutel      | Sleep   |    0 |                          | NULL             |    0.000 |
+--------+-------------+-----------------+--------------+---------+------+--------------------------+------------------+----------+
15 rows in set (0.006 sec)
Also posting a screenshot in case the formatting is getting messed up:
cc @miguel is these process list normal?
Following up on this
Hi PitzKey, sorry for delay
The list of processes looks normal. There are extra connections open to the database by vitalpbx user but none of those “commands” would eat up memory or CPU. During heavy usage you would see queries getting executed in that list. What it tells me is that server memory is not consumed by the SQL Queries. The database was nearly idling at the time of those screenshots.
Questions:
Are you still having same memory issues?
How long have you been using this system? Any recent configuration changes, updates or crashes?
Can you run this query?: SHOW GLOBAL STATUS LIKE ‘open%’;
MariaDB [(none)]> SHOW GLOBAL STATUS LIKE 'open%';
+--------------------------+---------+
| Variable_name            | Value   |
+--------------------------+---------+
| Open_files               | 28      |
| Open_streams             | 0       |
| Open_table_definitions   | 318     |
| Open_tables              | 622     |
| Opened_files             | 7171644 |
| Opened_plugin_libraries  | 0       |
| Opened_table_definitions | 317     |
| Opened_tables            | 628     |
| Opened_views             | 0       |
+--------------------------+---------+
9 rows in set (0.024 sec)
See screenshot above. It is consumed by MySQL.
As mentioned, I suspect that this is related to the maintenance scripts that were created by VitalPBX.
1 Like
Its just a piece of the puzzle but based on the info it seems that there is allot of Open_tables and Opened_tables which suggests that table_open_cache value might be too small.
MySQL opens tables and keeps them open because continually opening and closing tables is computationally expensive. “table_open_cache” is the setting that defines how many tables the server can keep open at once.
If you’re seeing that “Opened_tables” is consistently increasing, it could mean your “table_open_cache” is too small and MySQL is continually opening and closing tables because it can’t keep all the needed ones open. This constant opening and closing is computationally expensive and could indirectly increase memory usage.
Check the current value of table_open_cache with " SHOW VARIABLES LIKE ‘table_open_cache’; " . If the number of “Open_tables” is close to the “table_open_cache” then you may want to increase “table_open_cache”
Remember to make a copy of your original MySQL mysql.cnf config file before making changes to it. Make a backup of your database before restarting the mysql service
There are other variables that can help to understand what can possibly cause high memory usage:
innodb_buffer_pool_size
query_cache_size
thread_cache_size
sort_buffer_size
join_buffer_size
eg: SHOW VARIABLES LIKE ‘innodb_buffer_pool_size’;
Update:
This also shows on VitalPBX 4, perhaps @PitzKey or @miguel would chip in,
I found the following:
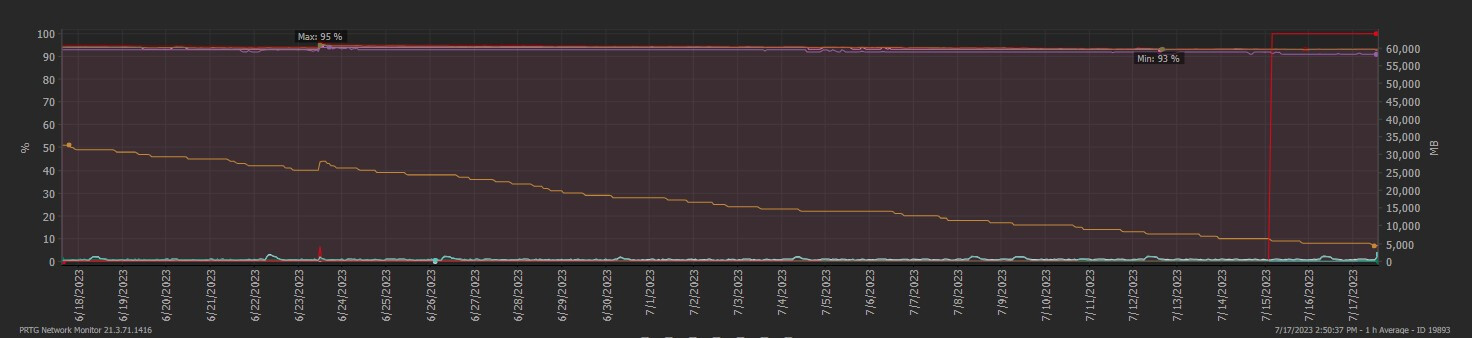
Mariadb usage has been steadily increasing for the last 30 days.
checking swappiness with:
sysctl -a |grep swap
Returns a value of
vm.swappiness = 60
Which is apparently a default setting and should be set to 1 (or 10 max) instead of 60 as per best practices, on the other hand, the following file:
/etc/mysql/conf.d/vitalpbx.cnf
is set to have innodb_buffer_pool_size=50G, meaning that will do 50G pool, combined with the vm.swappiness of 60 will cause the db to grow as large and dump it on swap space.
Are these intended to be set like that? Will I break anything by setting vm.swappiness = 10?
What happens when swap usage hits 100%?
regards,
Hi again, update:
Ran mariadbfix from the HA suite of tools and while that did a redo of the mariadb replication and recreated all dbs in slave, it also updated cdr and queues_log tables, these tables are being updated rather frequently now (these had stopped being updated sometime about a month ago).
Also updated vm.swappiness = 10, system appears to be working correctly.
Would it be of use if someone performed the vm.swappiness = 10 on a standalone VitalPBX 4 and mysql restart to test if results match the ones described above?
System status is now as follows:
Here’s all the information about it: