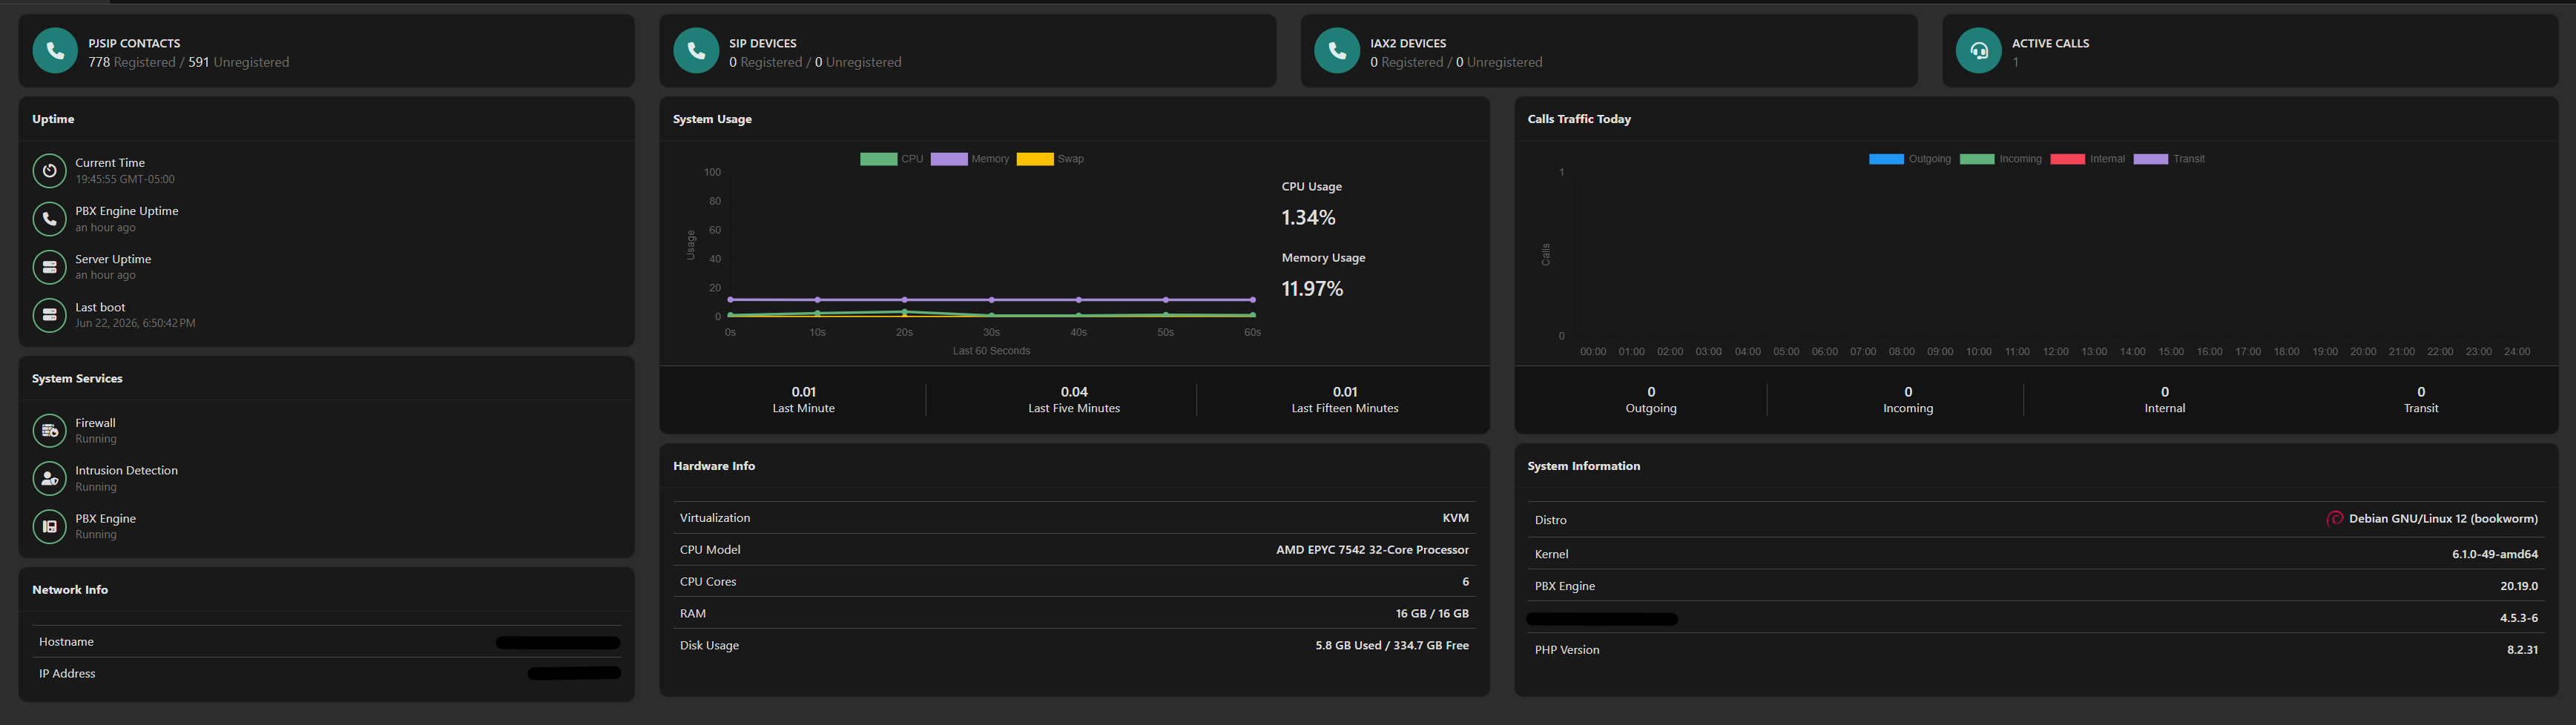
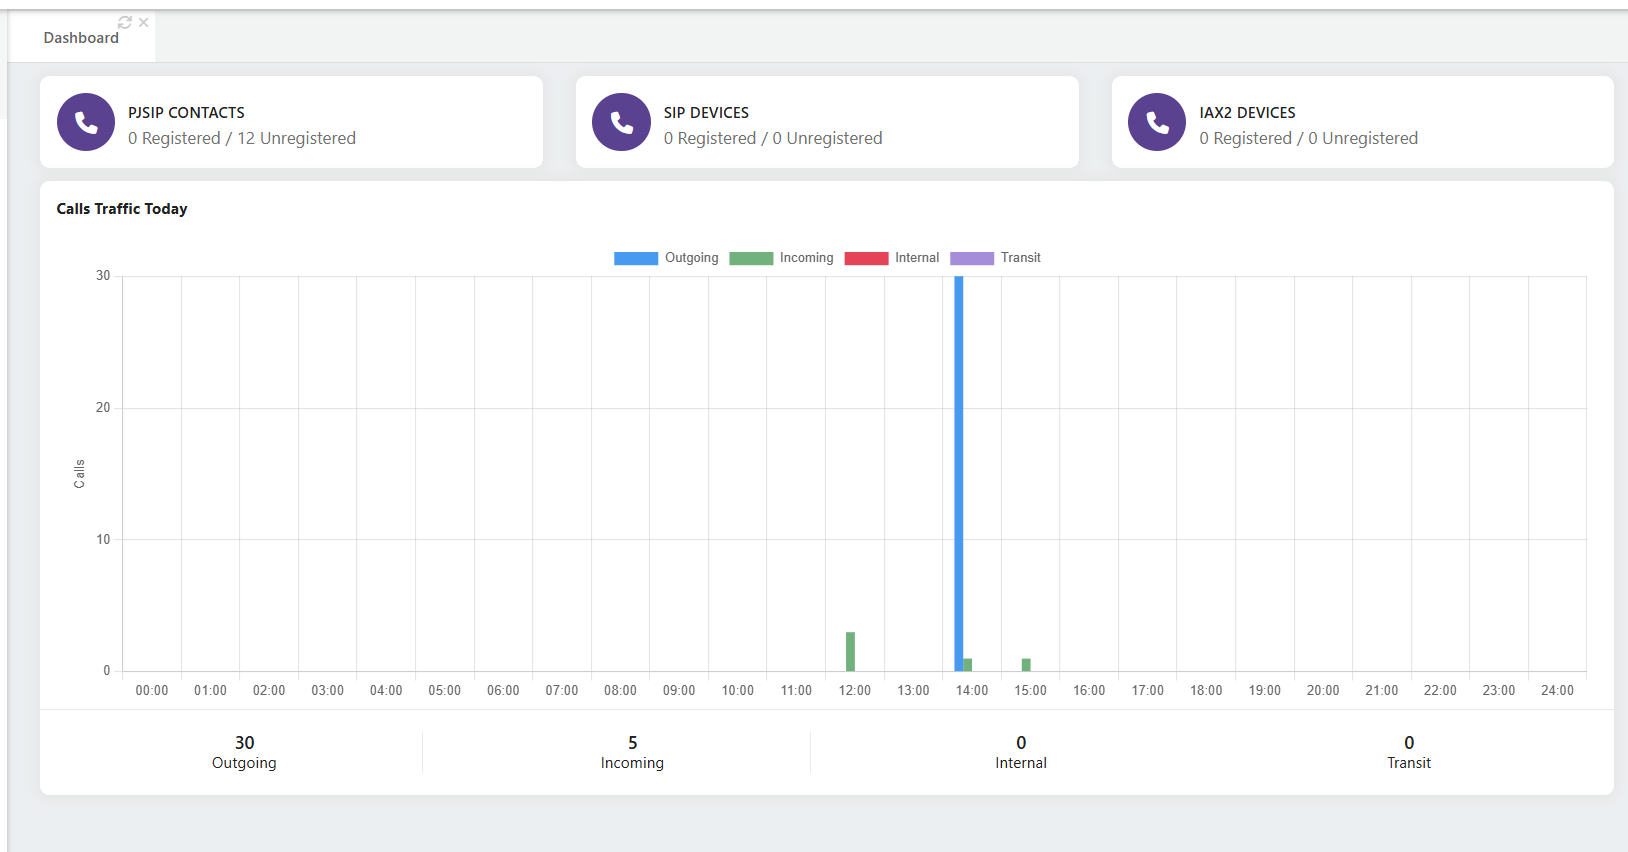
After updating to VitalPBX 4.5.3-6 (Asterisk 20.19.0), the main tenant dashboard no longer shows the combined “Calls Traffic Today” graph — it stays empty/at zero.
The individual tenant dashboards show their call traffic graphs correctly. It’s only the main tenant’s accumulated graph (all tenants combined) that doesn’t populate. This worked fine before the R6 update.
I’ve already confirmed the data and services are healthy:
CDR has today’s calls (1,461 rows since midnight)
The cdr_tenant_calltype_calldate index exists on the cdr table
MariaDB and vpbx-monitor are both running normally
check-integrity found and fixed some folder permissions, but the main graph is still empty after Apply Changes and a hard refresh
So the underlying data is fine — it looks like the main tenant accumulation specifically isn’t reading it.
Is this a known issue with R6, and is there a fix or workaround?
That is exactly what I observed after applying the update—no call traffic is being displayed.
I would strongly recommend implementing a more rigorous quality assurance process before releasing VitalPBX updates. As VitalPBX is widely deployed in production environments, updates should ideally go through comprehensive internal testing, followed by alpha and beta release phases, before being published as stable releases. This would help minimize the risk of introducing regressions or new issues into production systems.
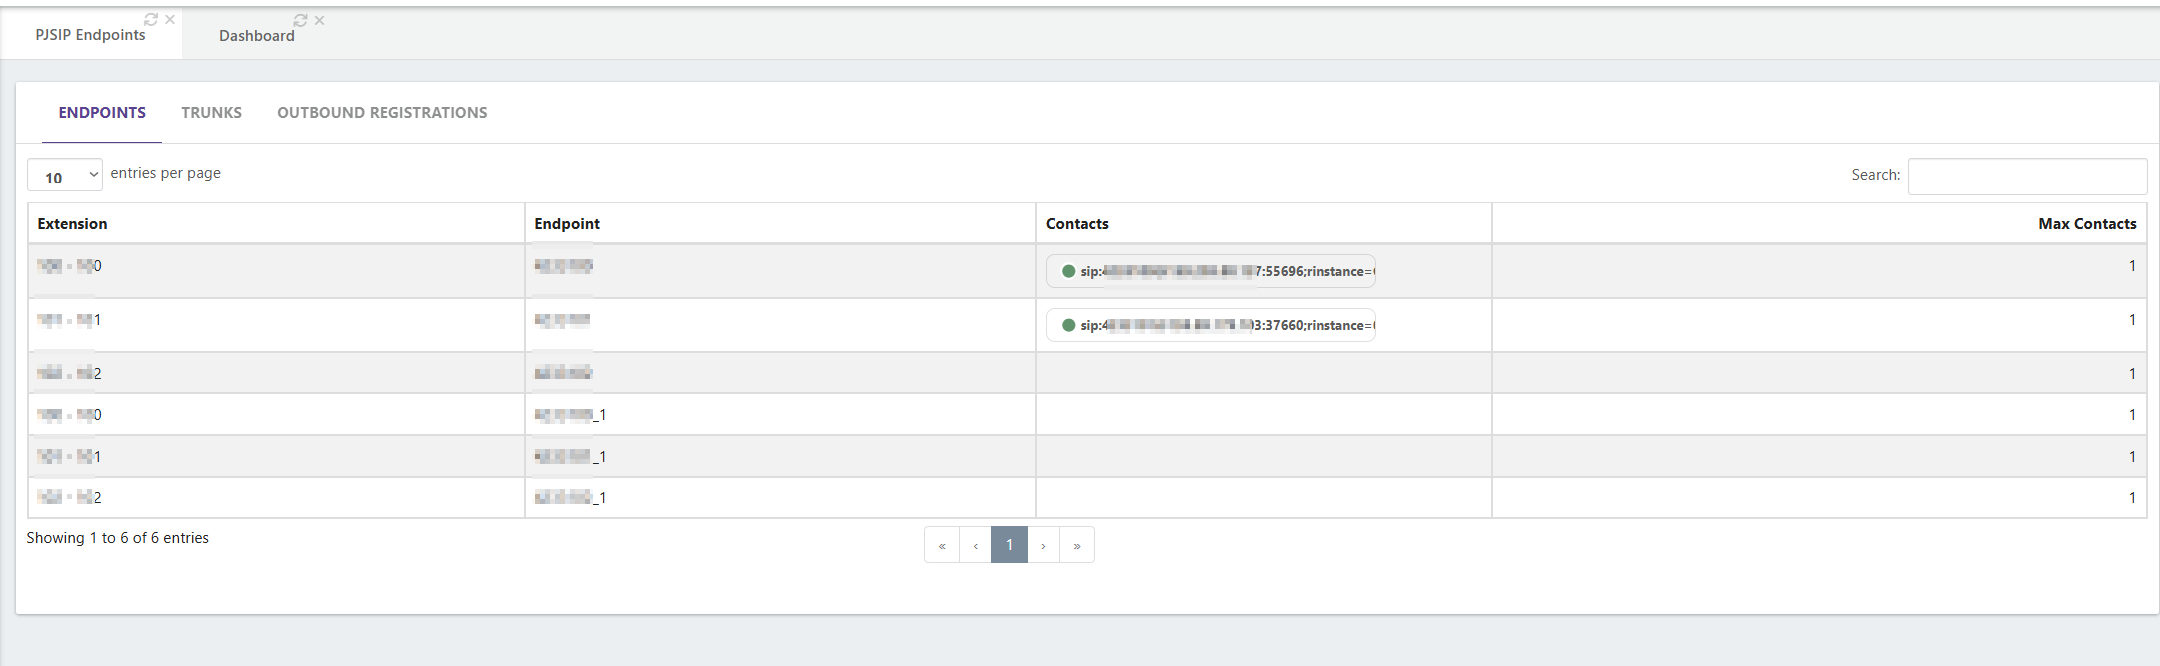
In addition, I would like to suggest several improvements to the “PJSIP Endpoints” report under “PBX Reports”, look at the below screenshot :
The Contacts column should be allocated more space to display the full contact information rather than truncating the value.
The Max Contacts column could be reduced in width, as it typically contains only a small numeric value (usually between 1 and 3 digits at max with most users).
Data alignment within the table would be more readable if values were center-aligned rather than left- or right-aligned.
The search functionality should support searching by IP address in contacts column in addition to the current search in just extension column.
Additional filtering capabilities would greatly enhance usability, such as filtering by:
Extension number (beside the current search ability of course)
Device type
Registration status (Registered/Reachable)
Unregistered or Unreachable endpoints
These enhancements would significantly improve the usability of the report and make troubleshooting and endpoint management more efficient, especially in environments with a large number of registered devices.
And that is a last little enhancement for user experience with little code modification.
I restarted the vpbx-monitor service and calls are keeps reaching the systems but the call traffic still the same not show any change on the counters (main tenant DashBoard)
Isn’t the “Calls Traffic Today” on the main tenant reflect the whole traffic that reach it and routed to its sub-tenants and also the outbound calls traffic that go out from its setup trunks?
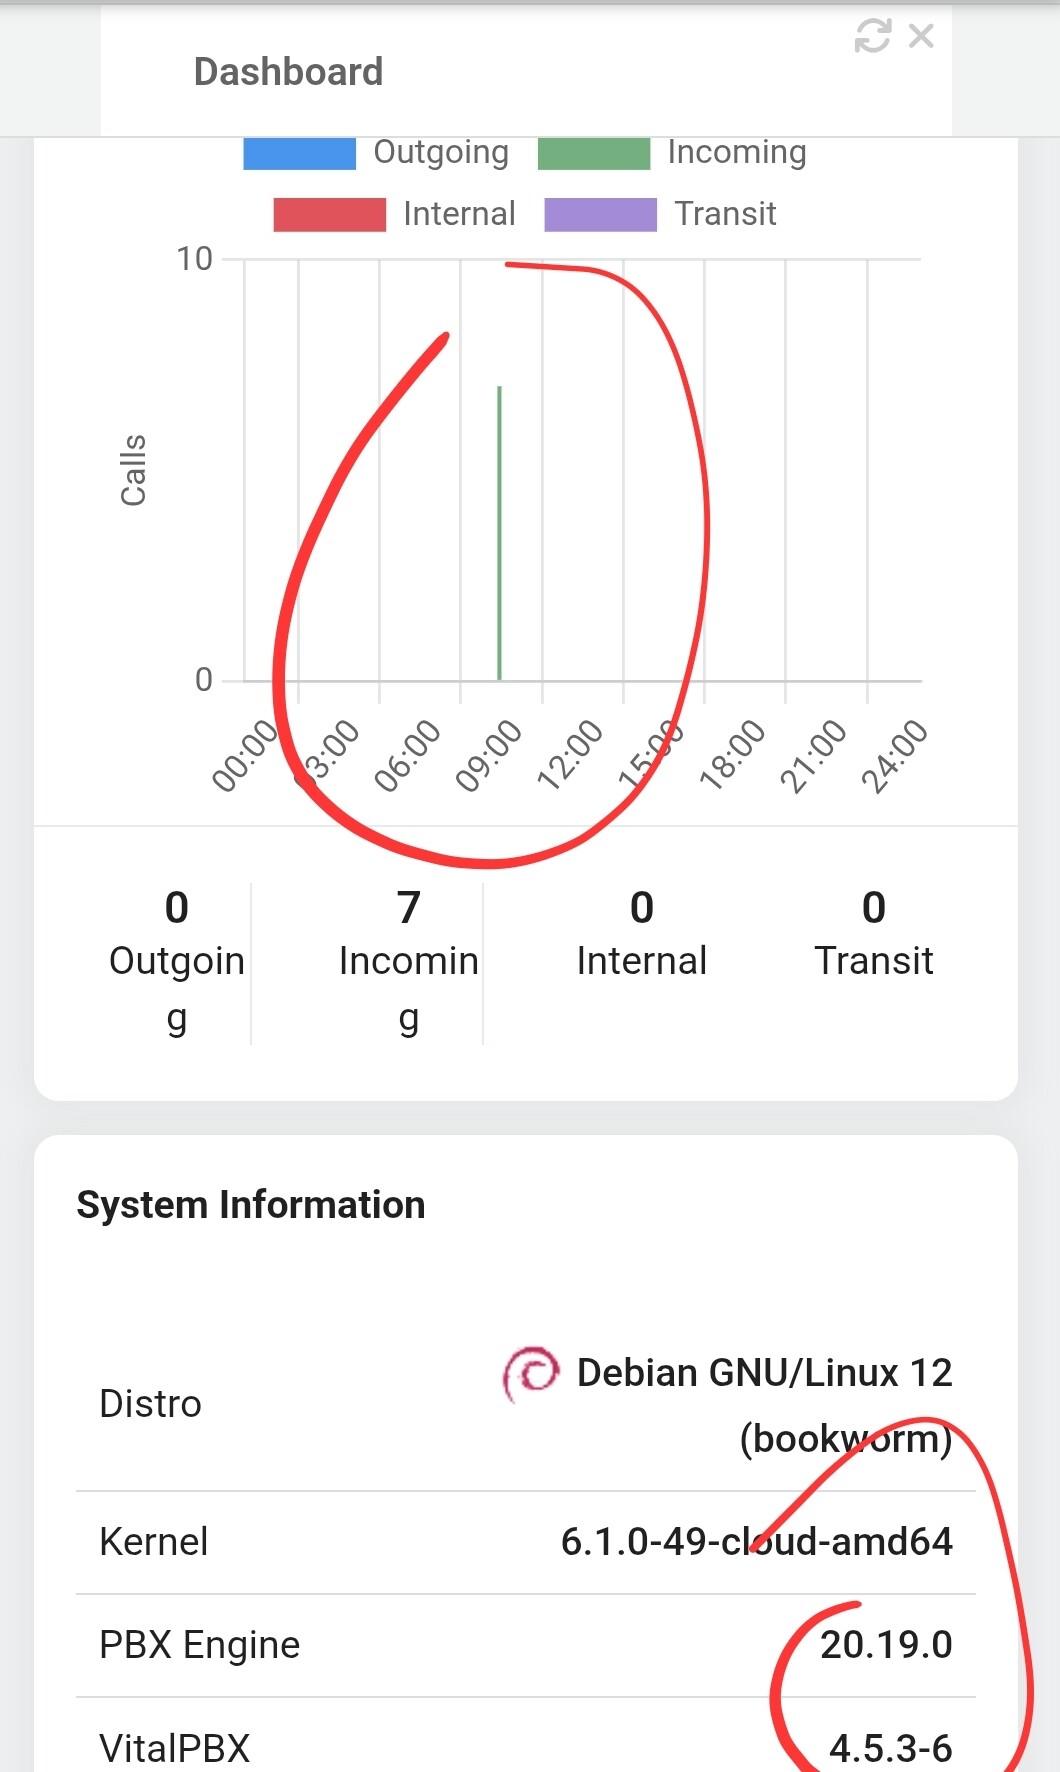
that two screenshot show that there is an issue with last update and the call traffic was working before that update (VitalPBX 4.5.3-6).
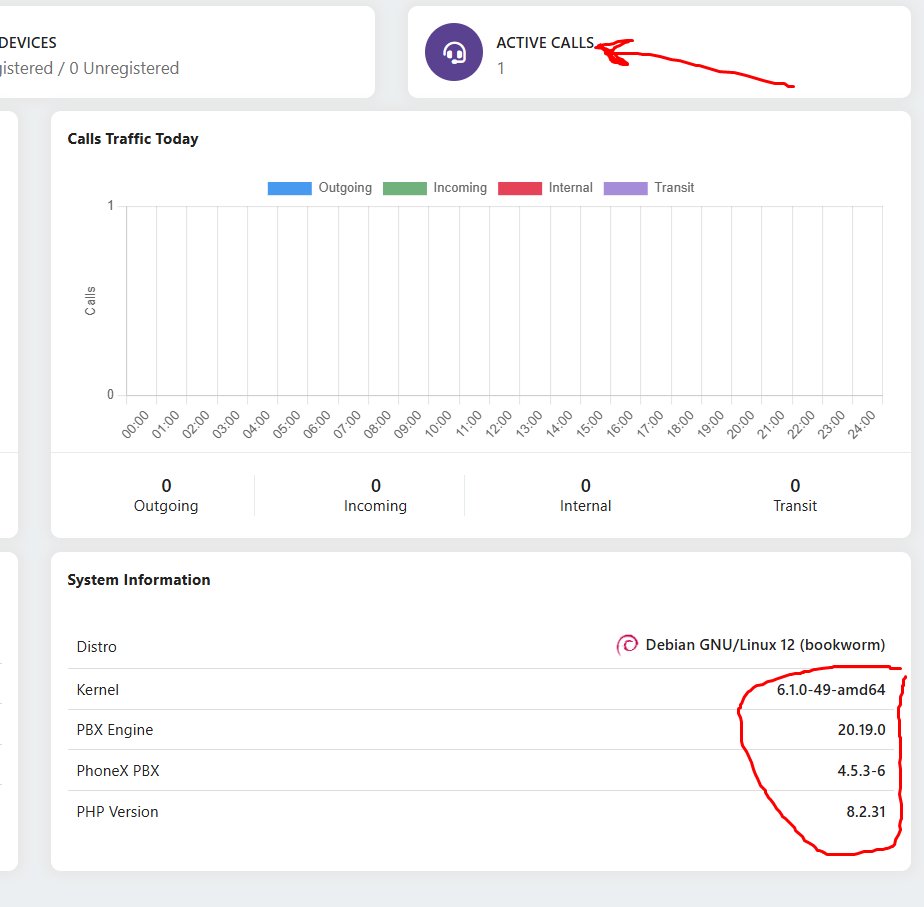
The 1st screenshot I shared shows that there are active call running and there were other calls before it that are completed and that is obvious on the 2nd screenshot timeline when compared with the 1st screenshot’s timeline too.
All calls are passing through the main main tenant as the provide trunks are already setup and configured on it and the DID are controlled from it and also the outbound rules and also active calls that reach to the sub-tenants
The addition you can provide to the update with the fix is the CDR of the main tenant show the whole sub tenants calls record with a new added column that show the tenant name (description) with a filter in the same page to filter the tenant call if selected, otherwise it show all calls CDR combined